Welcome to Aninkovsky — your destination for data visualization, animated charts, global statistics, and data-driven stories about our world.
Explore how countries, economies, companies, and technologies change over time through engaging visual comparisons and animated chart races.
📊 Economy: GDP rankings, economic growth, and global markets.
🌍 Countries: Population statistics, world rankings, and country comparisons.
📱 Technology: Smartphone, laptop, and social media market share.
🚄 Infrastructure: High-speed rail, highways, and renewable energy.
📈 Trends & History: Historical data and long-term global developments.
From economic rankings to technology trends, Aninkovsky transforms complex numbers into visual stories that are easy to understand.
Subscribe to Aninkovsky and discover the data, trends, and stories shaping our world — one chart at a time.
#DataVisualization #GlobalStatistics #ChartRace

Shared 8 hours ago
2 views

Shared 4 days ago
65 views

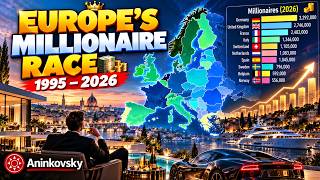
Shared 1 week ago
359 views

Shared 1 week ago
533 views


Shared 3 weeks ago
585 views

Shared 3 weeks ago
29K views


Shared 1 month ago
4K views

Shared 1 month ago
1.9K views

Shared 1 month ago
2.4K views


Shared 6 months ago
328 views


Shared 6 months ago
701 views


Shared 10 months ago
490 views