4:07
How to Read a Control Chart: When to Act and When to Leave It Alone
Vrolen
4:26
FMEA Explained: Severity, Occurrence, Detection and RPN in 5 Minutes
5:16
Kanban WIP Limits Explained: What to Do When Your Board Is Full
4:53
Lean vs Six Sigma Explained: What's the Difference?
5:57
DMAIC Explained: The Five Phases with One Example
5:01
Kaizen Explained: How Small Improvements Actually Work
5:04
Poka-Yoke Explained: Simple Ways to Prevent Mistakes
5:10
5S Explained: More Than Cleaning Your Workspace
4:39
PDCA Cycle Explained: Improve a Process Step by Step
Fishbone Diagram Explained: A Practical Root Cause Analysis Example
4:41
Pareto Charts—Which Complaint Should You Fix First?
5:06
OEE Explained: Availability, Performance & Quality (Worked Example)
6:35
8 Wastes of Lean Explained: Why Busy Doesn't Mean Productive
5:33
Value Stream Mapping Explained: Why 20 Minutes of Work Takes 3 Days
4:29
How to Find the Bottleneck in a Process (With an Example)
5:32
Push vs Pull Systems Explained: Why More Work Can Make Things Worse
5:53
Little's Law Explained: Why Starting More Work Makes Everything Later
5:08
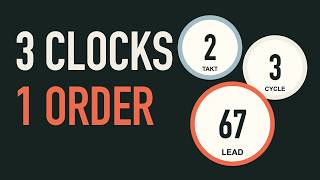
Takt Time vs Cycle Time vs Lead Time: One Order, Three Clocks
5:43
5 Whys Explained: A Practical Root Cause Analysis Example
3:32
Why a 5-Minute Task Takes 2 Days
LIVE